Correlation mechanism between texture and strength, electrical conductivity and residual stress in H
Correlation mechanism between texture and strength, electrical conductivity and residual stress in High strength and high conductivity Cu-Ni-Si alloy thin strip
Cu-Ni-Si alloys are widely used in the manufacture of lead frames and packaging materials for integrated circuits because of their high strength, high elasticity, and excellent electrical conductivity. With the continuous development of electronic information products, integrated circuits are developing in the direction of large-scale and ultra-large-scale, which prompts the development of high strength, high elasticity, and high conductivity lead frame. It also needs to have good plasticity and forming properties, that is, good flatness and low residual stress. The mechanical properties, electrical conductivity and internal residual stress distribution of the plate and strip are closely related to the texture.
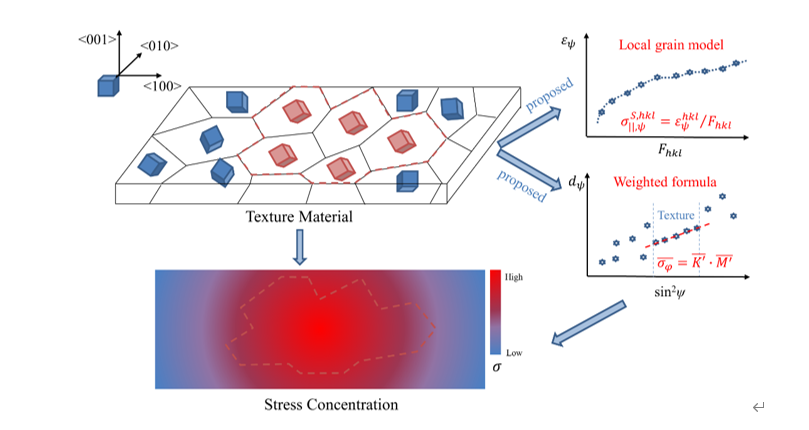
Starting from the texture evolution characteristics of the material, the team of Yinli Chen from the Collaborative Innovation Center of University of Science and Technology Beijing established a correlation model between texture and strength and residual stress by using XRD, HEXRD, HRTEM, and 3DAP characterization methods, and correlation mechanism between texture-strength-conductivity-shape accuracy is clarified. This study enriched the basic theory of the interaction mechanism between texture and strength and residual stress in copper alloy strip, laid a theoretical foundation for the method of controlling the strength and residual stress of copper alloy strip by texture.
Relevant research results have been published in Materials Science and Engineering: A, 2021, 814: 141239, Materials Science and Engineering: A, 2021, 826: 142023, Materials Characterization, 2020, 169: 110609 and other journals.
Paper 1 Links:https://doi.org/10.1016/j.msea.2021.141239
Paper 2 Links:https://doi.org/10.1016/j.msea.2021.142023
Paper 3 Links:https://doi.org/10.1016/j.matchar.2020.110609

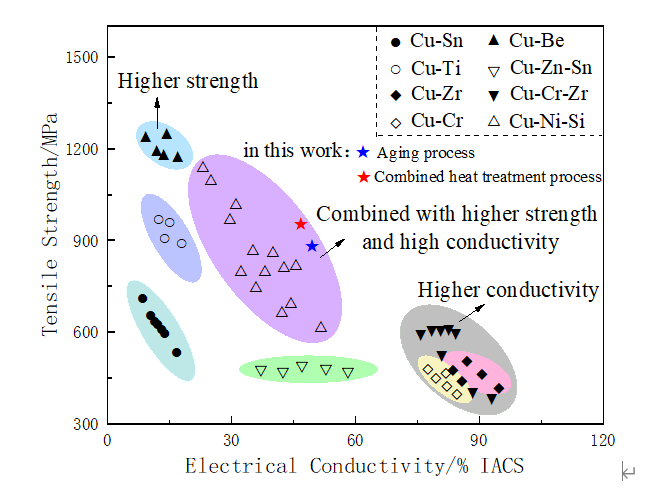
Fig.1. Tensile strength and conductivity of high-performance copper alloys for
lead frames

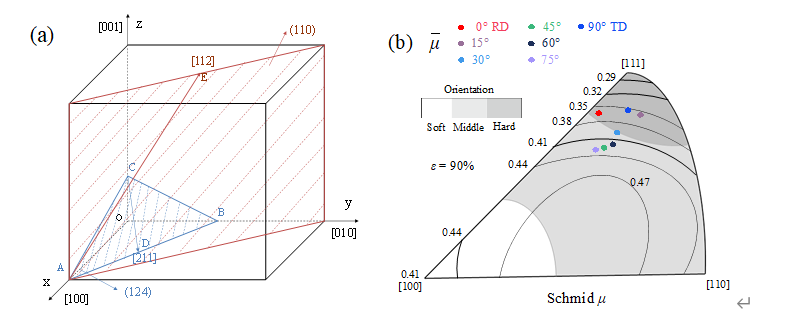
Fig.2. (a) Grain orientation of cubic System (b) Inverse pole diagram of SF value during tensile deformation of cold rolled specimen


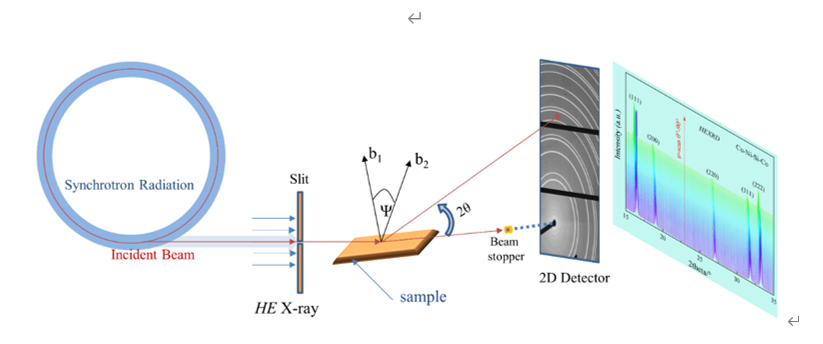
Fig.3. Measurement and correlation model of high energy synchrotron radiation on texture and residual stress of copper alloy strip

